Protax
This web application Protax allows you to identify any DNA sequence of a Finnish insect, as derived from the standard DNA barcode region, CO1, in FASTA format. It cannot distinguish between other taxa than insects.
Enter the DNA sequence (FASTA formatted) in the text field below or select the file using the selector.
- Text field
- File selector
.
Read more about Protax and how to interpret the results
Instructions
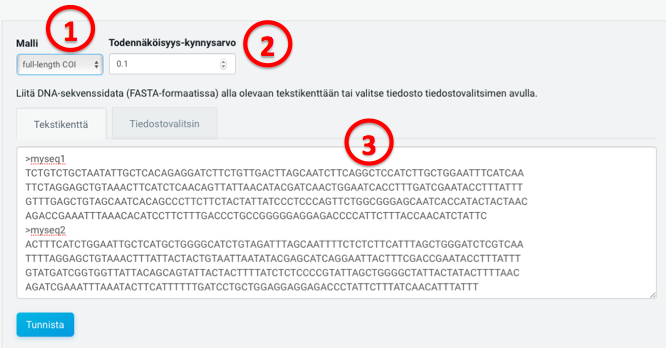
(1) Select either full length or Leray primer COI as the model
Model for full-length (658 bp) COI or amplicons of the Leray region (313 bp). This choice determines which model is used for taxonomic placement. Full-length model should be used unless the user is sure that all input FASTA sequences represent only the Leray primer region. Even for amplicons of Leray primer sequences, the full-length model will work, but the model specific to the Leray primer region is faster.
You can try examples of 10 sequences, 100 sequences or 6486 sequences.
(2) Select probability between 0-1 and minimum overlap between 1-500
For each input sequence, the output will include probabilities for all taxa exceeding the threshold. Thus, a low threshold value may yield a very high number of taxa and associated probabilities.
Minimum overlap between query and reference sequences after alignment to accept match. Note that p-distance is calculated over the entire length of the global alignment, but gaps are excluded from the alignment length. Therefore the presence of terminal gaps in some reference sequences may result to short overlaps if input sequence represents only a short fragment e.g. in the beginning of the COI region. Setting a minimum value to alignment length prevents including those p-distances that result only from short overlaps.
(3) Give COI sequences in a FASTA format, either copy-pasting to the text field, or selecting a file
Input sequences must represent the same strand as reference sequences (i.e. the forward primer direction of the standard COI PCR). Maximum file size is 4MB, which corresponds to about 6000-7000 sequences.
Click Identify, and you will get a zip file that contains two files:
- Text file listing the probability of each taxonomic placement at each level of the taxonomy. This is done separately for each input sequence.
- HTML file displaying the results as a Krona chart
This project has received funding from the European Research Council (ERC) under the European Union’s Horizon 2020 research and innovation programme (grant agreement No 856506).