Protax - service to identify DNA sequences of Finnish insects
This page gives background for the Protax application, which allows you to identify any DNA sequences of Finnish insects and spiders.
Background
The application uses all insect and spider sequences in the national barcode library, FinBOL, to determine the probability with which the sequence belongs to any particular insect taxon at a given taxonomic level (class, order, family, subfamily, tribe, genus, and species), or to a previously unknown taxon at the same taxonomic level. The latter probability should explicitly be interpreted as “a taxon not represented in the reference library” (including taxa which are simply something entirely else than insects).
For the coverage of the reference library generated by FinBOL, please see the table below. Since the identifier is trained to the information inherent in the exact gene region sequenced, you need to identify the primers used.
How to interpret the output
The output file contains taxonomic placements for each input sequence. The results for each sequence typically spans multiple lines, with each line containing the probability of taxonomic placement in a particular taxon. Note that any given input sequence can be attributed to several alternative taxa at the same taxonomic level – and to how many, that depends on the probability threshold specified in the input. There are five columns in each line:
seqid taxonomic_level finbif_taxon_code taxon_name probability
Seqid is the input sequence id given in a header line of each FASTA file entry.
There are seven taxonomic levels: 1) class, 2) order, 3) family, 4) subfamily, 5) tribe, 6) genus, and 7) species. Taxonomic names follow the checklist of Finnish species and probability is the probability of a sequence belonging to the taxon in question.
Below are three examples to demonstrate the contents of the output. Please also look at the note at the end of this document.
Example 1: Reliable identification up to the species level
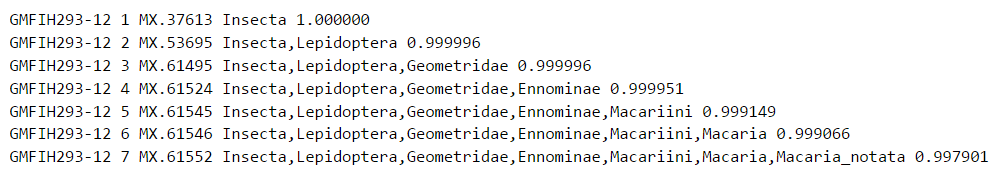
Probabilities will always decrease when proceeding from the class level towards the species level, since uncertainty increases with increasing taxonomic resolution. In this example, however, the probability of assignment to a particular species is high. Hence, it is highly likely that the input sequence ‘GMFIH293-12’ represents Macaria notata.
Example 2: Reliable identification up to the family level
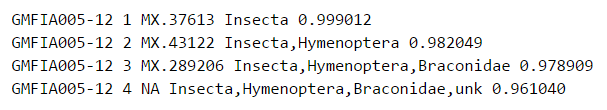
In this example, we only get the assignments up to the subfamily level – and at that level, the taxon is labelled as "unk". This “unk” stands for unknown, and represents taxa for which there are no reference sequences in our classifier. Such taxa will, per definition, include both known taxa for which no reference sequence was available, and taxa which are genuinely unknown. The interpretation of the result is that most likely the sequence belongs to the family Braconidae, but comes from a taxon under Braconidae of which FinBOL did not provide any reference sequences. This includes the cases where the sequence comes from an in itself known taxon under Braconidae for which we held no reference sequence, but indeed includes the possibility that the sequence comes from a taxon under Braconidae which was not included in the current taxonomy adopted from FinBIF.
Note: For unknown taxa there is no FinBIF taxon code, therefore it is replaced by NA (Not Available).
Example 3: Barcode sharing

In this example, we see high probabilities of assignment up to the genus level, whereas at the species level, the probability is divided evenly between three species. In this particular case, the three species do indeed have identical barcode sequences. Therefore, a mere COI sequence is not enough to tell the three taxa apart. The interpretation of the result is thus that the sequence most likely represents genus Elasmostethus, and that within this genus, it represents one of the species E. brevis, E. interstinctus, or E. minor – whereas there is no way to tell which one it is. Further information would this be needed to re-rank the species. For example, if we knew that some of these species are unlikely to occur at the site where the sequence sample was collected, then we could narrow the remaining possibilities.
This example also serves to demonstrate a naming issue unrelated to barcode sharing:
The taxon names at Level 4 and 5 include the word "dummy". This is because in the taxonomy used to train the classifier, there were no subfamilies or tribes specified between family Acanthosomatidae and genus Elasmostethus. Since our taxonomic classifier assumes that each path from the root of the taxonomy to the species level has the same number of levels (seven), any missing intermediate level names have been added to the taxonomy by giving them a name starting with the word “dummy”. This does not affect the outcome, i.e. the sequence is still most likely associated with the genus Elasmostethus.
Note: there is no FinBIF taxon code for "dummy" taxon names, therefore output has NA in the 3rd column.
Taxonomy pie chart
In addition to the text file that contains the taxonomic placements and their probabilities for each input sequence, the output also includes an html file where the results are shown in the form of an interactive taxonomy pie chart. This representation has been produced using the Krona tool. It allows visual browsing of the results at all levels of the taxonomy.
When clicking 'Color by Confidence' on the left hand side of Krona html display, each taxon receives a color corresponding to the following six categories. Categories 1-3 correspond to taxa of which the training set included reference sequences, whereas categories 4-6 correspond to taxa of which no reference sequences were available.
- (red). More than half of the sequences placed in this taxon have a probability over 0.9
- (yellow). At least one of the sequences in this taxon has a probability over 0.9
- (green). No sequence in this taxon has a probability exceeding 0.9
- (turquoise). More than half of the sequences have a probability over 0.9
- (blue). At least one of the sequences has a probability over 0.9
- (magenta). No sequence has a probability exceeding 0.9
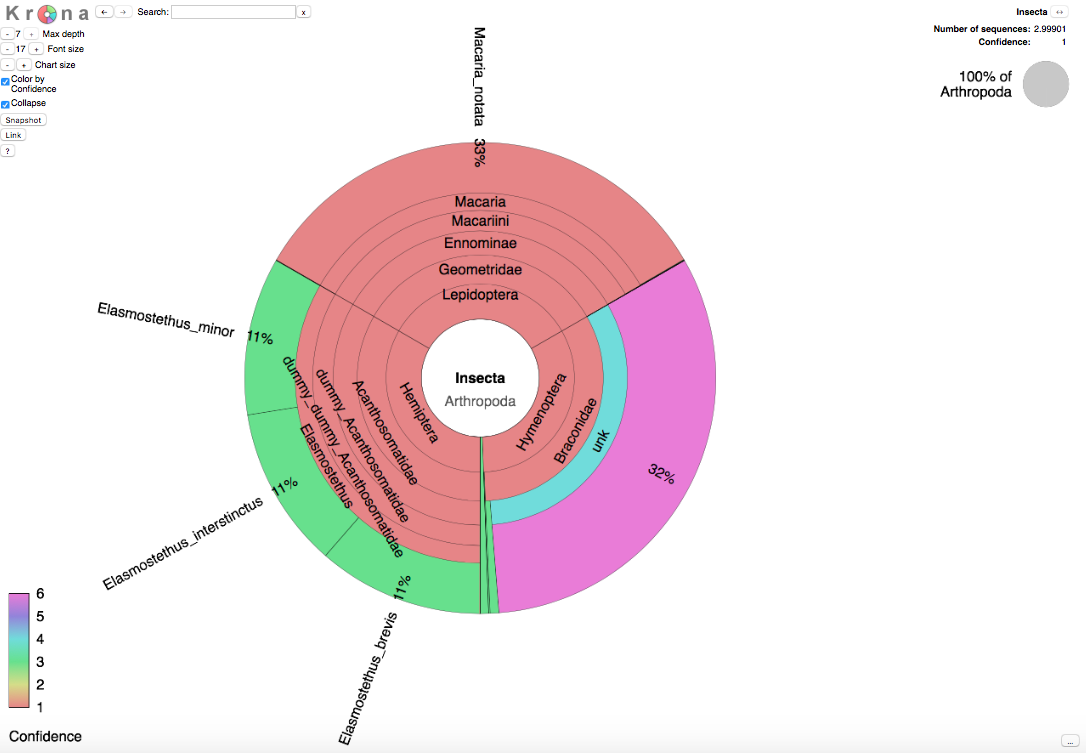
In the Krona wheel, the size of each taxon corresponds to the expected number of sequences assigned to it. The expected number of the sequences is the sum of probabilities from all input sequences within each taxon.
As an example, the picture below shows the Krona wheel resulting from the three sequences described above.
How does it work?
Taxonomic placement is based on a taxonomy, a set of reference sequences, and a model for converting sequence (dis)similarities into taxon-specific probabilities. We use the probabilistic taxonomic classifier PROTAX. For each input sequence provided by the user, we implement the following steps:
- Hidden Markov model based alignment against reference sequences
- Computing p-distances between input sequence and all reference sequences
- Converting p-distances into probabilities by means of a multinomial regression model
- Reporting all taxa and their probabilities that exceed the probability threshold specified by the user
P-distance is the number of mismatching nucleotides divided by the length of the alignment. Only positions with an A,C,G or T in both the input sequence and a reference sequence are included for calculating the length of the alignment, i.e. gaps and Ns are excluded. For more details of the method, please see Roslin et al. 2021. For more details regarding PROTAX, please see Somervuo et al. 2016a and Somervuo et al. 2016b.
Note: the current Protax implementation only identifies Insecta and Arachnida
The classifier has been trained to give probabilistic taxonomic placements for Finnish insects. The majority of the reference sequences represent Insecta and a few sequences represent Arachnida. The classifier does not have any knowledge of COI sequences outside of these taxa. Therefore, if the user provides COI sequences representing some other taxa than Insecta or Arachnida as input, the classifier cannot tell where these sequences come from. Most likely, these sequences will then get a high probability for “Insecta,unk” and low probabilities for known taxa at the order level or levels below it.
To avoid this slowing down classification of bulk data, it might still be beneficial to use some other classifier to first filter out sequences beyond Arthropoda, and then run the present classifier for the remaining sequences.
References
- Roslin, T., [95 co-authors] & Mutanen, M. 2021. A molecular-based identification resource for the arthropods of Finland. Molecular Ecology Resources https://doi.org/10.1111/1755-0998.13510.
- Somervuo P, Koskela S, Pennanen J, Nilsson HR, and Ovaskainen O. Unbiased probabilistic taxonomic classification for DNA barcoding. Bioinformatics. 2016 Oct 1;32(19):2920-7. doi: 10.1093/bioinformatics/btw346
- Somervuo P, Yu DW, Xu CCY, Ji Y, Hultman J, Wirta H, and Ovaskainen O. Quantifying uncertainty of taxonomic placement in DNA barcoding and metabarcoding. Methods in Ecology and Evolution. 2017 8,(4): 398-407. doi: 10.1111/2041-210X.12721